
Staying informed about moving trends is crucial in navigating the dynamic landscape of the relocation industry. As a long-time member of the moving industry, Movers Development understands the importance of having moving industry statistics from past years to inform your efforts in the upcoming season.
This article will discuss the current moving trends of 2023, exploring how technology, sustainability, and convenience continue to reshape how we move. We’ll explore the disruptive impact of COVID-19 on moving trends and the lasting alterations it has brought to the forefront. Finally, we will delve into an analysis spanning 2016 to 2019, shedding light on preferences and practices.
Fewer Americans moving, but bigger relocations boost moving industry revenue
From 2016 onward, fewer and fewer Americans moved. In 2016, only 11.2% of Americans moved – a historic low. However, this was mitigated mainly because the average size of relocations increased. That was maybe the most compelling reason why the revenue of the moving companies rose even though the number of relocations fell.
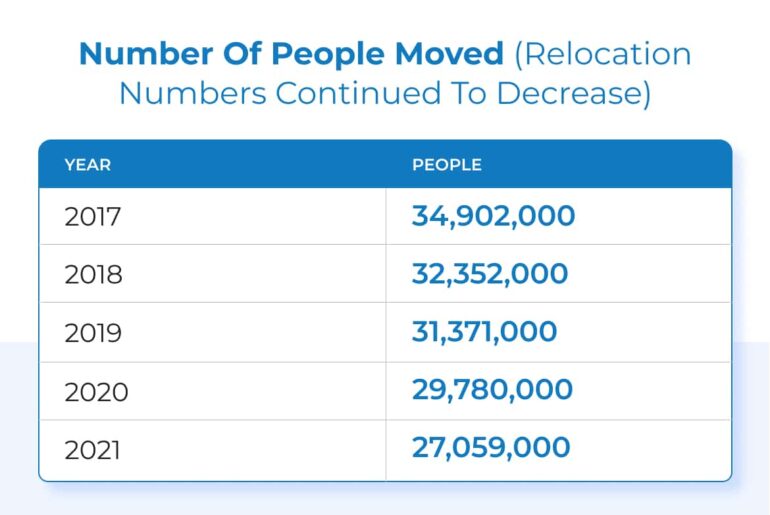
Coupled with the emergence of COVID-19 and the rising trend of smaller relocations, the moving industry had reasons for concern.
Impact of COVID-19 on moving trends
Indeed, the COVID-19 pandemic has significantly reshaped moving trends in the US. It brought many changes in the moving industry and people’s relocation habits.
- With remote work becoming the norm for many professionals, the need to be close to traditional workplaces has diminished. That prompted a surge in migration from densely populated urban centers to more suburban and rural areas.
- Lockdowns and stay-at-home orders also underscored the importance of living spaces, leading many individuals and families to seek larger homes with outdoor spaces and home offices. As a result, a notable shift towards home purchases in less densely populated regions drove up demand in real estate markets outside of major cities.
- Additionally, the pandemic’s economic impact influenced more cautious approaches to relocation, as individuals and families reassessed their financial stability and weighed the risks of moving amidst uncertain times.
- Finally, virtual tools, online platforms, and website development also played a pivotal role in facilitating property viewings, inspections, and paperwork signings. Such tools made relocation processes smoother and allowed individuals to be even more critical of their potential destinations.
COVID-19 transformed the moving industry by altering consumer preferences and behaviors. It also spotlighted the role of technology in making the process more adaptable to changing circumstances, as moving trends show.
Current moving trends in 2023
With this groundbreaking turn of events, it should be no wonder why moving statistics changed in 2023. All of the above factors and criteria have continued to evolve in response to shifting dynamics and lifestyles:
- Reasons for moving have remained diverse, with a significant focus on seeking more spacious and comfortable homes as remote work arrangements persist. Additionally, lifestyle changes, the desire for better amenities, and the pursuit of lower living costs have emerged as primary motivations.
- The spring and summer months, particularly from April to August, continue to be the busiest periods for moving, coinciding with favorable weather conditions and school breaks.
- Fridays and Saturdays have emerged as the most popular weekdays for moving, allowing individuals and families to have the weekend to settle into their new spaces without taking extended time off work.
- Larger relocations, such as 3-bedroom homes and beyond, have risen due to families seeking more living space. Conversely, the demand for studio or single-bedroom moves has slightly decreased as remote work enables people to prioritize comfort over location.
- Moving destinations have shown a trend of diversification, with suburban and rural areas maintaining popularity, driven by the ongoing appeal of larger homes and outdoor spaces. Major metropolitan areas, however, continue to draw young professionals seeking career opportunities and cultural experiences.
These trends collectively reflect a complex interplay of remote work, changing priorities, and economic considerations. However, the moving industry adapted to this situation – as we’ve all had to.

#1 Where are people moving to?
With basic moving trends in order, let’s delve deeper into what 2023 has been showing – starting with destinations.
Past years have shown southern states’ popularity, which still holds somewhat true. While 27% of Americans wish to move to California, its high cost of living proves prohibiting. Instead, Americans have so far opted for the following cities, in order:
- Myrtle Beach, SC/Wilmington
- Sarasota, FL
- Orlando, FL
- Ocala, FL
- Houston, TX
- Dallas-Fort Worth, TX
- Knoxville, TN
- Jacksonville, FL
What people want from movers in major cities, remained the same. Metropolitan moving, still, requires expertise in city-specific challenges, with a focus on timely communication, careful handling, and understanding of urban nuances to stand out in a competitive market.
In addition, the post-COVID landscape has illuminated the split between cities and rural areas. The suburbs are proving popular with many, as data shows:
- 25% of all relocations were from cities to suburbs
- 39% of all relocations were to suburbs from any area
- Of all rural residents who moved, 31% also moved to the suburbs
What makes this data odd, at first, is that about 40% of Americans prefer to live in cities. However, much like plans for California moves, the cost of living and local economies seem to take precedence over preference.
#2 Why are people moving?
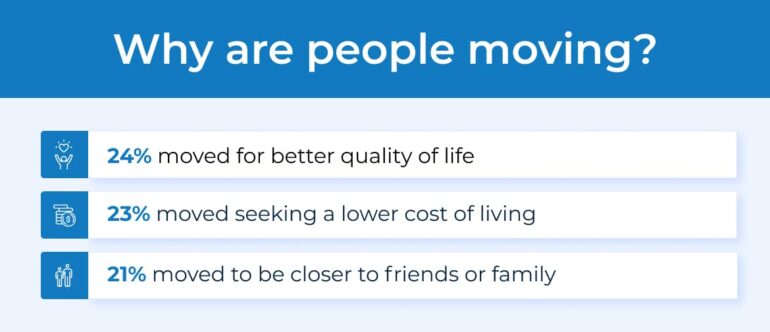
On that note, the reasons for any move have also shifted somewhat. Old moving trends remain, to an extent, but Americans’ priorities have visibly changed:
- 24% moved for better quality of life, including cleaner air, recreational opportunities, and other everyday factors
- 23% moved to seek a lower cost of living or due to better home prices, which is a key element of moves, as we’ve seen
- 22% moved because of a need to upsize, maintaining the trend of previous years to some extent
- Another 22% moved due to work flexibility – such as the ability to work remotely or to get a more flexible job
- 21% moved to be closer to friends or family, again maintaining previous years’ moving trends
Then, not everything has changed. Enough has, however, since the advent of COVID that moving professionals need to stay vigilant.
#3 Upsizing and downsizing
Having mentioned upsizing, this element of moving also deserves some attention. That’s especially true considering the apparent generational divide in this regard.
- 50% of boomers upsized, while only 32% of millennials did so
- 31% of boomers downsized, compared to 40% of millennials
- 19% of boomers opted for the same size, compared to 28% of millennials
For one, this does prove that boomers don’t often downsize for retirement. 69% of them did not, which is highly notable. In addition, it illustrates both the economic struggles and choices millennials face – both highly notable for professionals catering to them.
#4 Hiring movers
How many Americans are opting for professional movers, speaking of? Flexibility is indeed a top priority, and so is affordability. As such, not many among those who move seek full relocation services:
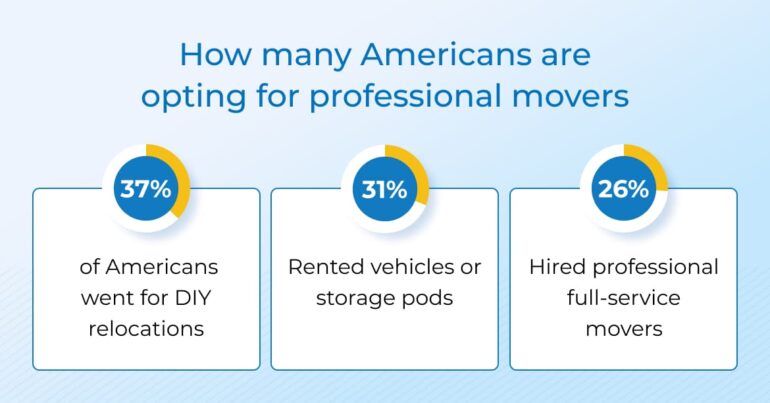
These moving trends are indeed concerning to some extent. By all means, moving professionals can adapt and tailor their services to “mixed” relocations. In many cases, they likely have to.
But this may show, beyond economic woes, that the industry needs to win customers back – regardless of the current struggles facing everyone. Thankfully, advancing technology and changing customer values, partly in response to COVID, may offer a way forward.
Sustainability and mobility trends
Indeed, moving trends dictated a new direction and a new path forward. Alongside the above, consumers started to value sustainability and green initiatives. Undoubtedly, COVID’s strain on supply chains and the broader market played a part in this shift. Ways to advertise your moving business, have also undergone major changes.
Since 2019, sustainability has taken center stage in the US moving industry. Many moving companies have embraced green initiatives, adopting measures such as:
- using bio-diesel or electric vehicles for transportation
- utilizing reusable packing materials
- optimizing routes to minimize fuel consumption
These green practices are being well-received by environmentally conscious consumers who seek to minimize their carbon footprint during the moving process. With the industry under strain, renewed trust from customers was very welcome.
In addition to sustainability efforts, current mobility trends indicate a notable shift in popular destinations and reasons for moving. While suburban and rural areas remain attractive due to spacious homes and natural surroundings, there is a growing trend towards smaller towns and cities that balance career opportunities and a more relaxed lifestyle.
Remote work also remains a significant driver, enabling individuals and families to choose locations based on personal preferences rather than proximity to traditional workplaces. This trend has redefined the importance of factors such as quality of life, access to outdoor activities, and community engagement, ultimately shaping the evolving landscape of the US moving industry.
The role of technology in the moving industry
If there’s one thing the pandemic has taught us, then it’s that adaptability is vital. Moving companies have started adopting digital tools, virtual consultations, and sustainable practices to meet evolving consumer demands.
Indeed, in 2023, technology has become an integral driving force in transforming the moving industry:
- The increasing role of technology is evident through the adoption of innovative digital tools that enhance customer satisfaction and streamline the moving process. For instance, moving quote calculators have revolutionized how customers receive estimates, providing transparency and convenience.
- Additionally, virtual consultations and property assessments conducted through video conferencing have minimized physical interactions, which is especially relevant in the wake of the COVID-19 pandemic. Online platforms have enabled customers to track their belongings in real time, fostering a sense of control and trust.
- Furthermore, technology has facilitated route optimization, leading to efficient logistics and reduced carbon footprints. Embracing these technological advancements has not only improved the overall customer experience but has also enhanced the operational efficiency of moving companies, ultimately reshaping the industry into a more modern, accessible, and responsive landscape.
As moving trends change, so must we. The customer and their habits have changed, but thankfully, technology advances in equal measure. By continuously improving our businesses and our industry, we can secure a better future of trusting customer relationships, eco-consciousness, and newfound relocation efficiency.
Moving Trends Analysis (2016 – 2019)
Well before COVID’s impact on the moving industry, moving trends were indeed in flux. Much changed within the four short years spanning from 2016 to 2019. To keep information digestible, consider the following year-by-year data on specific elements of relocations.
#1 Reasons for moving
First, this period saw notable changes in the motives behind relocation. Across most studies, three key reasons are pinpointed: housing, job opportunities, and family.
- Housing reasons. This category includes individuals who relocate to find cheaper housing, move into a better home, or to own a home instead of renting. In 2016, a significant percentage of people (42%) moved within the US for housing-related reasons. The trend largely persisted in 2017, increasing to roughly 48%, and remained at 55% in 2018. 2019 maintained roughly the same percentage at 54%, but saw a historical migration decline – as we’ll see next.
- Job Opportunities. This category includes individuals who moved due to a new job or a company transfer. In 2016, 20.2% moved for a job. According to United’s data, 2017 saw a massive surge to 55%. 2018’s data is conflicting in that Statista data and other outlets pinpoint “work-related moves” at 18%, but United Vans Lines identifies that “46.6% of individuals moving south did so due to job changes”. Finally, 2019 saw moves related to job opportunities revert to roughly 17% – alongside initial COVID disruptions.
- Family reasons. Lastly, this category includes individuals who moved to be closer to family for retirement or other family-related reasons. In 2016, 27.7% stated they moved for family reasons. United finds that number inflated to 38% in 2017, as 21% moved to be closer to family and 17% moved due to retirement. In 2018, Statista finds that family considerations lowered to 21%. Finally, 2019 saw that percentage remain at 21%.
As you can see, moving trends did shift considerably over time during this period. Housing-related reasons grew, while job opportunities spiked and reverted to pre-2016 percentages. Family reasons also declined by 2019.
#2 Moving destinations
Where people decided to move is a timelessly relevant data point. If you’re in the relocation industry, you likely understand how significantly such trends can affect your business.
In 2016, the five most popular states to relocate to were the following:
- California
- Florida
- Texas
- New Jersey
- Illinois
2017 did not see a change here, but 2018 did. Most notably, Georgia, New York, and Wisconsin cities suddenly appeared among top 10 destinations:
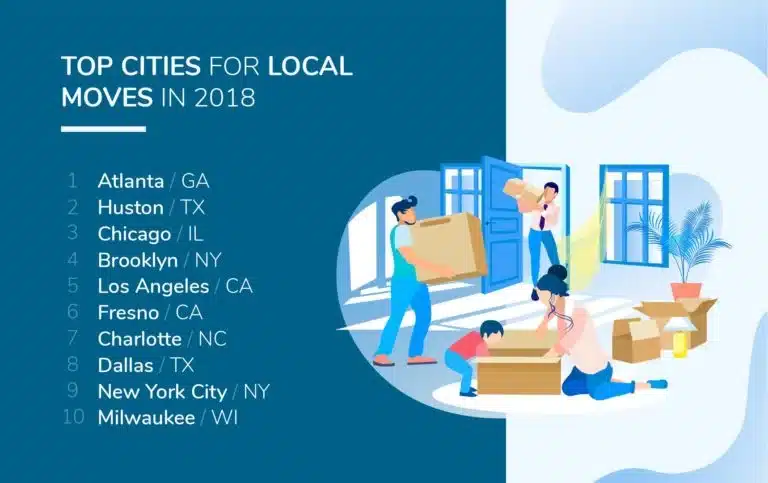
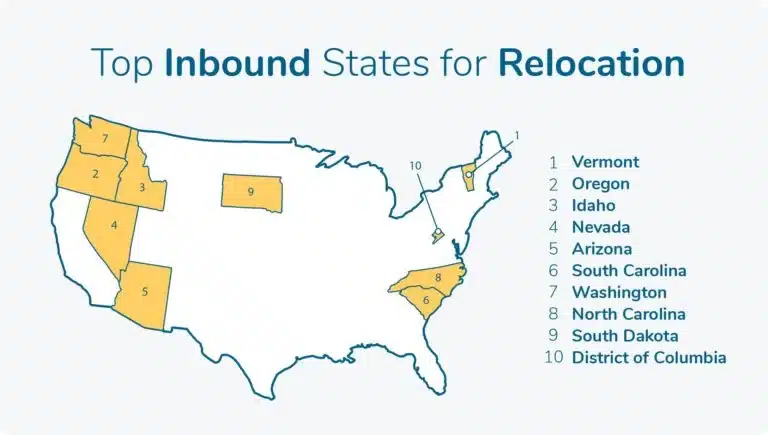
Lastly, 2019 saw another notable change. By then, the 10 most popular relocation destinations were:
Of course, these moving trends were in no small part shaped in response to the others outlined above. For example, those seeking to move because of their job would naturally move to states with booming employment opportunities.
#3 Busiest moving parts of the year
The busiest moving months of each year also saw some notable changes.
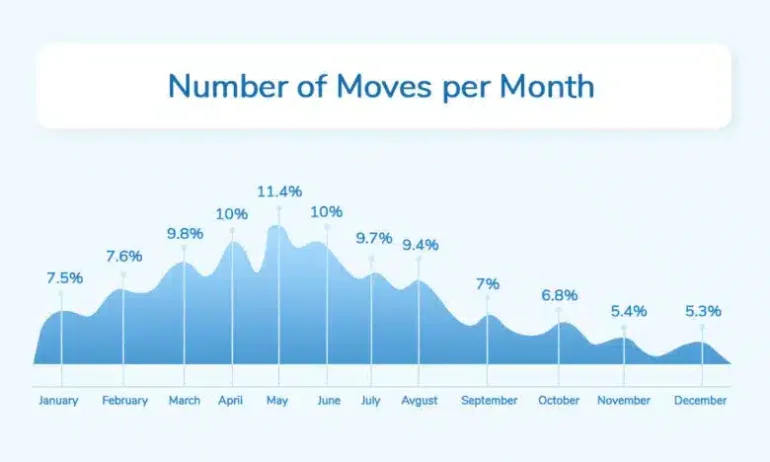
- May – 10.15% in 2016, 10.36% in 2017, 10.49% in 2018, 11.4% in 2019
- June – 13.91% in 2016, 13.65% in 2017, 13.11% in 2018, 10% in 2019
- July – 12.60% in 2016, 12.1% in 2017, 11.72% in 2018, 9.7% in 2019
- August – 11.39% in 2016, 11.76% in 2017, 12.09% in 2018, 9.4% in 2019
- September – 8.58% in 2016, 8.62% in 2017, 8.71% in 2018, 7% in 2019
- October – 8.08%, in 2016, 7.83% in 2017, 7.17% in 2018, 6.8% in 2019
- November – 6.64% in 2016, 6.32% in 2017, 6.09% in 2018, 5.4% in 2019
- December – 3.31% in 2016, 3.23% in 2017, 3.26% in 2018, 5.3% in 2019
- January – 4.25% in 2016, 4.02% in 2017, 3.49% in 2018, 7.5% in 2019
- February – 5.91% in 2016, 6.1% in 2017, 6.40% in 2018, 7.6% in 2019
- March – 7.17%, in 2016, 7.9% in 2017, 9.05% in 2018, 9.8% in 2019
- April – 8.00%, in 2016, 8.24% in 2017, 8.42% in 2018, 10% in 2019
Here, too, some moving trends bear noting. During this period, more Americans opted to move during colder months than during traditionally busier summer months. Peak season preparations remaining an important topic in the moving industry circles.
#4 Busiest moving weekdays
Similar trends were observed as regards moving weekdays. Typically, the relocation industry sees its busiest weekdays in Fridays, Saturdays, and Mondays. This period only saw some minor changes in this regard:
- Sunday – 8.02% in 2016, 8.21% in 2017, 7.69% in 2018, 8.4% in 2019
- Monday – 15.7% in 2016, 15.9% in 2017, 16.15% in 2018, 16.1% in 2019
- Tuesday – 9.89% in 2016, 10.2% in 2017, 10.67% in 2018, 11.3% in 2019
- Wednesday – 13.4% in 2016, 13.1% in 2017, 13.27% in 2018, 12.4% in 2019
- Thursday – 13.1% in 2016, 13.3% in 2017, 13.60% in 2018, 13.2% in 2019
- Friday – 19.67% in 2016, 19.9% in 2017, 20.22% in 2018, 19.8% in 2019
- Saturday – 17.95% in 2016, 18.23% in 2017, 18.40% in 2018, 18.7% in 2019
All in all, weekdays remained largely similar during this period. Tuesdays became slightly busier as Wednesdays became less so, and Saturdays saw a slight uptick.
#5 Relocation sizes
Relocation sizes bear noting. That is, what houses people moved into. This metric too offers some insights of note:
- Studio – 8.4% in 2016, 8.7% in 2017, 9.37% in 2018, 10% in 2019
- 1 bedroom – 25.2% in 2016, 26.75% in 2017, 28.81% in 2018, 30% in 2019
- 2 bedroom – 23.4% in 2016, 22.3% in 2017, 21.16% in 2018, 24% in 2019
- 3 bedroom – 16.9% in 2016, 17.5% in 2017, 20.27% in 2018, 16% in 2019
- 4+ bedroom – 10.4% in 2016, 8.3% in 2017, 7.70% in 2018, 7% in 2019
- Partial move – 15.7% in 2016, 13.4% in 2017, 12.69% in 2018, 13% in 2019
Moving trends present only a few differences here too. 4+ bedroom and partial moves decreased notably, while studio moves and 1-bedroom moves gained traction.
Forecast for future moving season peak
With all of the above moving trends in mind, one question remains: where do we go? While only slightly humorous, this is likely the question on the lips of most of us in the moving industry.
It would seem that our direction is marked by a blend of past data and ongoing trends, with the lingering effects of COVID-19 playing a significant role:
- Remote work’s enduring presence will likely continue shaping the industry. Individuals and families increasingly prioritize larger living spaces, suburban locales, and areas offering improved work-life balance. This factor will inform both moving destinations and relocation sizes.
- While the gradual recovery from the pandemic may lead to increased stability, economic considerations could introduce variables that impact demand. How each state’s economy shapes up will inform relocation destinations, while individual financial leeway will inform how many people relocate.
- As the market recalibrates, the industry’s focus on eco-consciousness, flexibility, and technology integration will remain vital. How we are setting the stage for a more resilient and customer-centric future will directly inform customer trust and habits.
Unfortunately, this complex web of circumstances makes accurate forecasts nearly impossible. For instance, there’s ample likely demand; some 55% of US adults want to relocate. The reasons they want to do so continue 2019’s moving trends, too – but the economy will dictate their actions.
As such, our best course of action as professionals is to remain flexible and resilient. We have ample ways to do so, by streamlining our processes, adopting technology, building customer trust, and so on. Where we go is uncertain, but where we should go seems clear.